Bitcoin Supply Shock: Exchange Inflow Trend Lowest Since 2015
On-chain
data
shows
the
Bitcoin
exchange
inflow
trend
has
been
at
its
lowest
in
almost
a
decade
recently,
a
sign
that
may
be
bullish
for
the
asset.
Bitcoin
Exchange
Inflows
Have
Been
On
The
Decline
Recently
As
pointed
out
by
CryptoQuant
author
Axel
Adler
Jr
in
a
post
on
X,
the
BTC
exchange
inflows
have
been
heading
down
for
a
while
now.
The
“exchange
inflow”
is
an
on-chain
indicator
that
keeps
track
of
the
total
amount
of
Bitcoin
the
investors
deposit
to
wallets
attached
to
centralized
exchanges.
When
this
metric’s
value
is
high,
it
means
that
holders
are
transferring
a
large
number
of
coins
to
these
platforms
right
now.
As
one
of
the
main
reasons
why
investors
might
deposit
coins
in
the
exchanges’
custody
is
for
selling
purposes,
this
kind
of
trend
can
be
bearish
for
the
asset.
On
the
other
hand,
the
low
indicator
implies
the
exchanges
aren’t
receiving
many
deposits
currently.
Depending
on
the
trend
in
the
opposite
metric,
the
exchange
outflow,
such
a
trend
can
be
either
bullish
or
neutral
for
the
cryptocurrency’s
price.
Now,
here
is
a
chart
that
shows
the
trend
in
the
Bitcoin
exchange
inflow
over
the
past
decade:
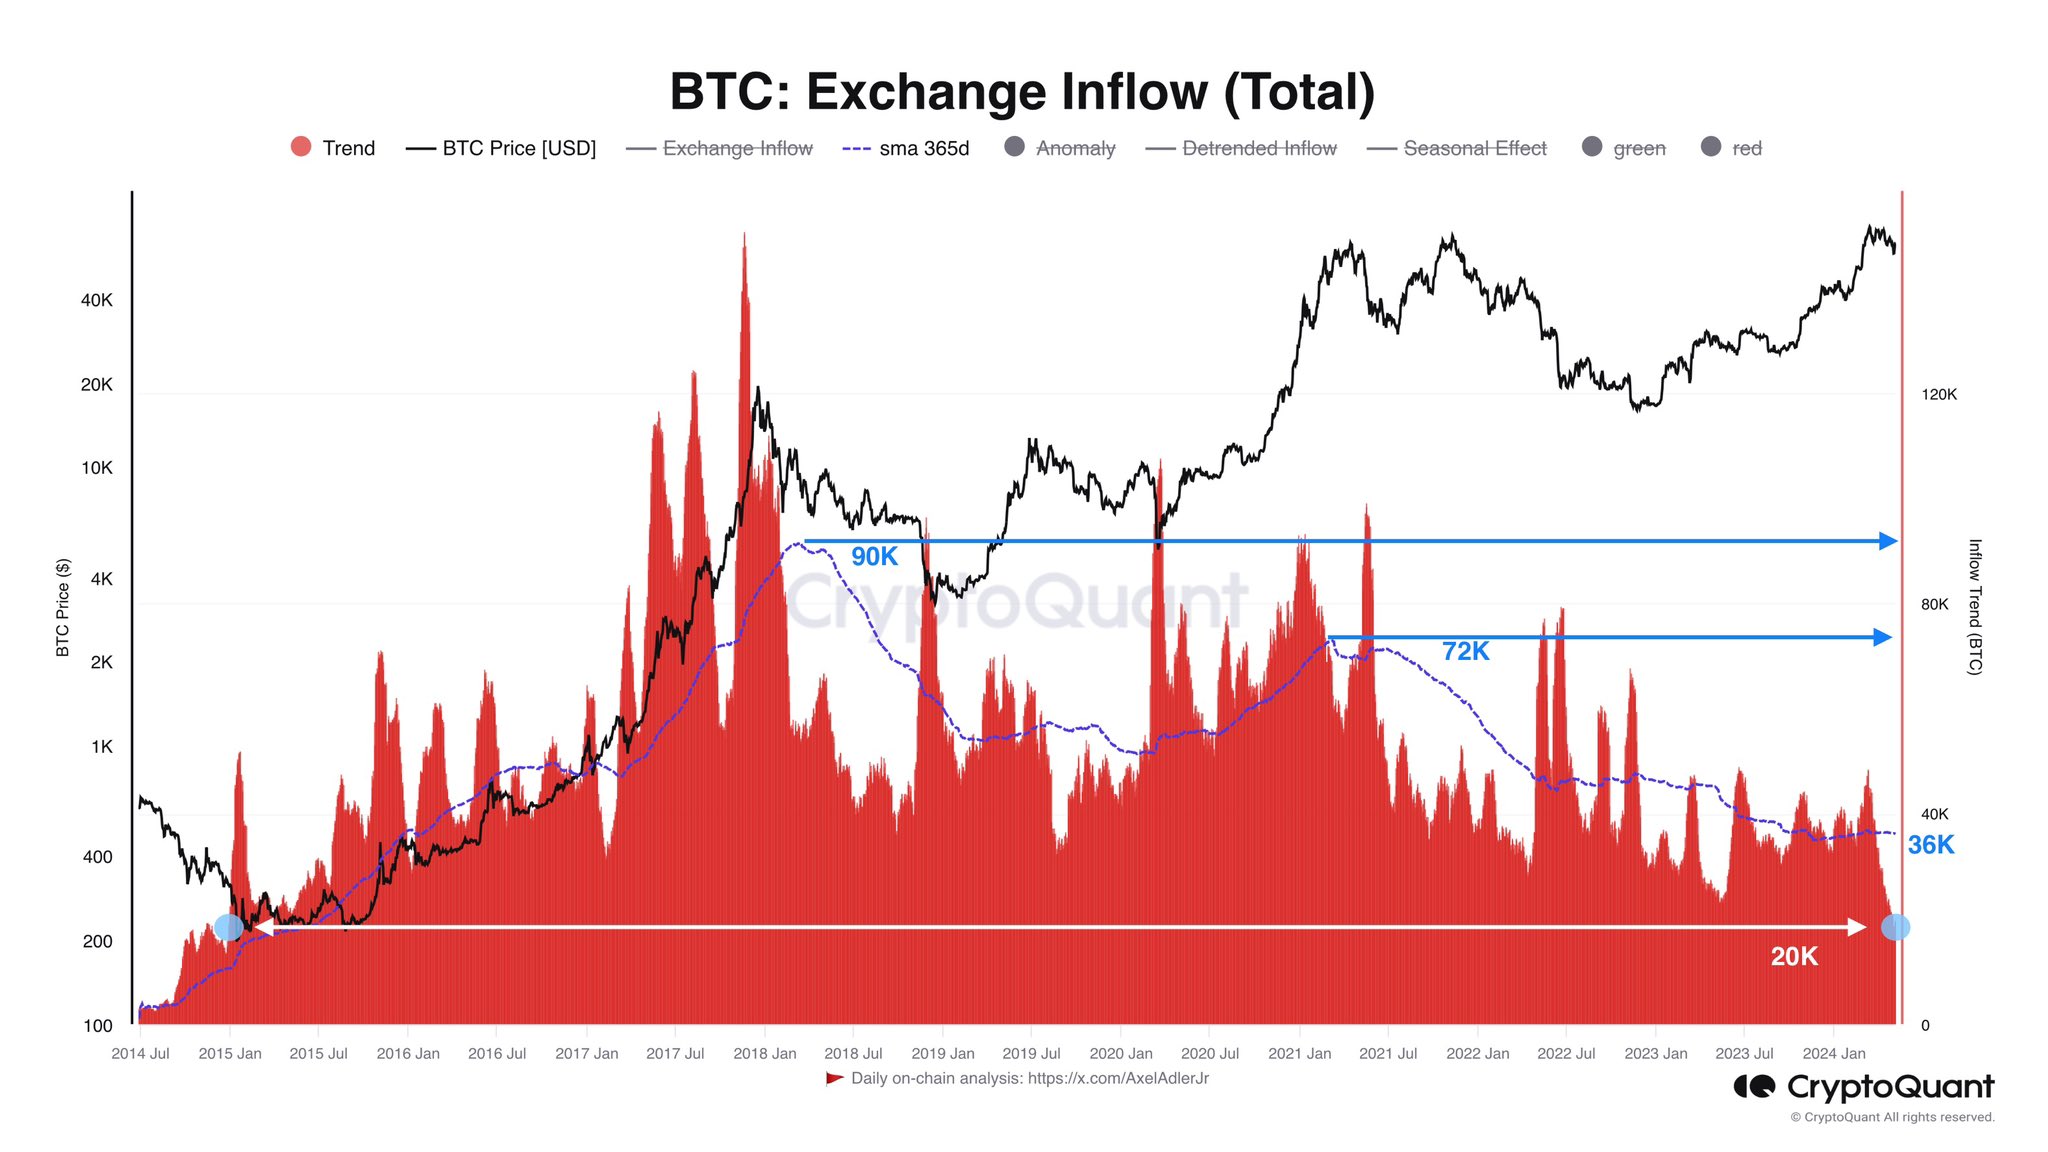
The value of the metric seems to have been going down in recent weeks | Source: @AxelAdlerJr on X
As
displayed
in
the
above
graph,
the
trend
of
the
Bitcoin
exchange
Inflow
is
sitting
at
20,000
BTC
right
now,
the
lowest
value
the
market
has
seen
since
2015.
The
analyst
has
also
attached
the
data
for
the
indicator’s
365-day
moving
average
(MA)
to
the
same
chart.
This
line
has
been
on
the
decline
since
February
2018,
dropping
from
90,000
BTC
to
36,000
BTC
today.
The
decline
in
the
exchange
inflows
could
indicate
that
the
appetite
for
selling
the
cryptocurrency
has
reduced.
If
so,
due
to
how
supply-demand
dynamics
work,
the
price
could
naturally
benefit
from
a
bullish
effect
from
this
pattern.
However,
there
could
be
another
explanation
for
this
long-term
trend,
and
it’s
the
fact
that
the
exchanges
haven’t
played
a
constant
role
in
the
market
throughout
these
years.
In
the
2017
cycle,
the
exchanges
were
relevant
in
the
market,
so
they
actively
received
huge
deposits.
Still,
during
the
2021
cycle,
new
ways
to
invest
in
Bitcoin
popped
up,
which
may
explain
why
the
drop-off
occurred
between
the
two
periods.
Today,
Bitcoin
finds
itself
in
an
era
when
spot
exchange-traded
funds
(ETFs)
have
gained
approval
and
are
attracting considerable
demand.
With
these
ETFs,
cryptocurrency
exchanges
are
bound
to
have
lost
more
relevance,
hence
why
it
looks
like
this
cycle
will
see
even
fewer
deposits
than
the
2021
epoch.
BTC
Price
Bitcoin
had
recovered
beyond
$65,000
earlier
during
the
past
day,
but
the
asset
seems
to
have
slipped,
as
it’s
now
back
down
to
$63,100.
Looks like the price of the coin has been heading up over the last few days | Source: BTCUSD on TradingView
Featured
image
from
Kanchanara
on
Unsplash.com,
CryptoQuant.com,
chart
from
TradingView.com
Comments are closed.