Bitcoin Adoption Slows Down To Multi-Year Lows, But Why?
On-chain
data
shows
the
Bitcoin
adoption
rate
has
slowed
to
the
lowest
since
July
2018.
Here’s
what
could
be
behind
this
trend.
Bitcoin
New
Addresses
Count
Has
Plunged
To
Multi-Year
Lows
According
to
data
from
the
market
intelligence
platform
IntoTheBlock,
an
interesting
trend
has
appeared
in
the
Bitcoin
New
Addresses
metric.
The
“New
Addresses”
indicator
keeps
track
of
the
total
number
of
new
addresses
created
on
the
BTC
network
every
day.
When
this
metric
has
a
high
value,
it
suggests
many
new
addresses
are
currently
popping
up
on
the
blockchain.
Such
a
trend
could
indicate
that
new
investors
are
entering
the
cryptocurrency.
However,
this
isn’t
the
only
reason
why
the
metric
would
register
an
increase,
as
old
investors
who
had
exited
earlier
could
also
contribute
to
the
indicator’s
value
when
they
return.
Holders
making
multiple
wallets
for
privacy
purposes
would
also
naturally
influence
the
metric.
In
general,
though,
all
of
these
are
happening
at
once
to
some
degree,
so
on
the
net,
some
adoption
would
occur
for
the
asset.
Thus,
a
high
number
of
new
addresses
can
be
a
bullish
sign
in
the
long
term.
On
the
other
hand,
the
indicator’s
low
value
potentially
suggests
the
cryptocurrency
isn’t
currently
attracting
fresh
investors.
Naturally,
this
would
possibly
imply
a
bearish
outcome
for
the
asset.
Now,
here
is
a
chart
that
shows
the
trend
in
the
7-day
average
New
Addresses
metric
for
Bitcoin
over
the
history
of
the
asset:
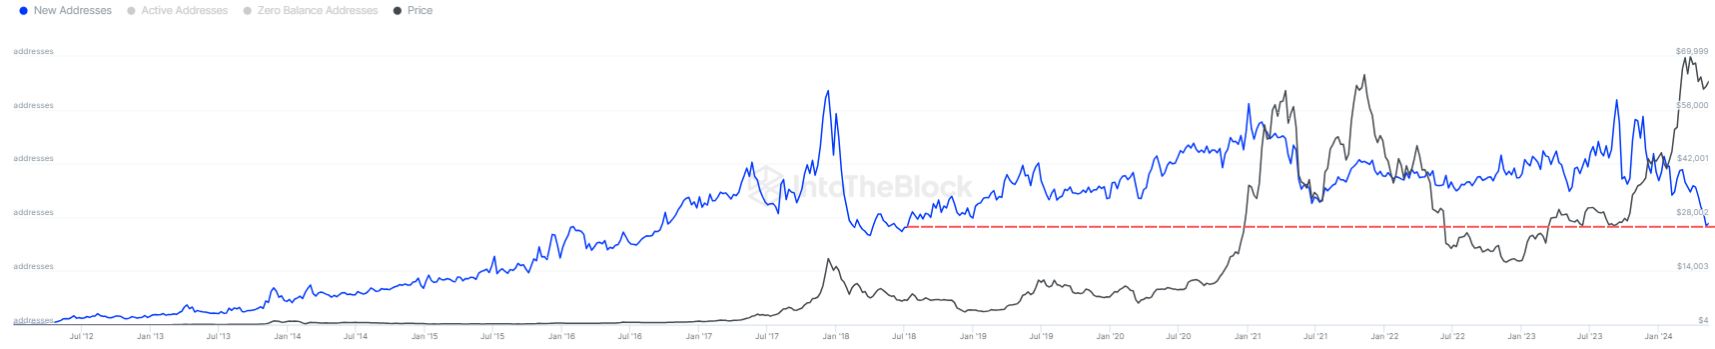
The value of the metric appears to have been going down in recent months | Source: IntoTheBlock on X
As
the
above
graph
shows,
the
7-day
average
of
Bitcoin
New
Addresses
has
declined
this
year.
This
suggests
that
fewer
and
fewer
new
hands
are
potentially
entering
the
asset.
Following
the
latest
decrease,
the
metric’s
value
has
dropped
to
just
276,000,
the
lowest
since
July
2018.
The
chart
shows
that
a
sharp
cooldown
in
new
addresses
has
generally
coincided
with
the
end
of
bullish
periods.
Thus,
going
by
this
pattern,
the
latest
rally
may
have
run
out
of
steam.
There
can,
however,
be
alternative
reasons
for
the
recent
trend
rather
than
just
a
lack
of
interest
among
investors.
A
big
event
for
Bitcoin
at
the
start
of
the
year
was
the
approval
of
spot
exchange-traded
funds
(ETFs)
by
the
US
Securities
and
Exchange
Commission
(SEC).
Spot
ETFs
are
investment
vehicles
that
provide
an
alternate
route
of
gaining
exposure
to
the
cryptocurrency
in
a
format
that’s
more
familiar
to
traditional
investors.
It’s
possible
that
the
new
users
these
days
simply
prefer
to
buy
into
spot
ETFs
instead.
Since
this
adoption
is
happening
off-chain,
it
makes
sense
why
an
on-chain
metric
wouldn’t
be
able
to
detect
it.
BTC
Price
At
the
time
of
writing,
Bitcoin
is
trading
at
around
$66,100,
up
more
than
5%
over
the
past
week.
Looks like the price of the asset has surged recently | Source: BTCUSD on TradingView
Featured
image
from
Dmytro
Demidko
on
Unsplash.com,
IntoTheBlock.com,
chart
from
TradingView.com
Comments are closed.